|
GSI
FRS
|
|
HOW TO WRITE A DATASET FOR GRAF DATA:
I Required Dataset Specifications:
Standard ASCII dataset, lines not longer than 256 characters.
II Contents of the Dataset: (with examples ==> )
1. Title of the plot (required in first line of the dataset)
==> Fission barriers of Ac isotopes
2. Description of the x-axis (optional, may appear in any line)
==> X: neutron number
an additional minus sign inverts the x-axis ==> X-:
3. Description of the y-axis (optional, may appear in any line)
==> Y: Bf$ / MeV
an additional minus sign inverts the y-axis ==> Y-:
4. Header, defining the following data block
==> H: X Y1(droplet),D1 Y2(total)
The header line must begin with "H:", "H2:", "A:"
"A2:" or "N:"
"H:" header line for 1-dim. data
"H2:" header line for 2-dim. data
"A:" header line for data of a 1-dim. pseudoanalyzer
"A2:" header line for data of a 2-dim. pseudoanalyzer
"N: or N2:" ignore the following data block
4.1 One-dimensional data
The data may be specified by
"X","Y","S","B","A","M","D"
or "N"
"X" in this column follows an x-array
If the x values are equidistant, the data of the x array can be replaced by a loop in the
header line (in parentheses)
,==> H: (X = 1 TO 100 BY 0.5) Y(text),H0
As a general rule, implicit definitions of data, like the x values in the above example,
always appear in parentheses. In the following example, both x and y are implicitly defined:
==> H: (X = 0.1 TO 4.3 BY 0.05) (Y = -X),LT0
A binsize for a data block may be specified by
==> H: X,BIN(4) Y(text),H0
That means that 4 consecutive values are summed up (analog data) or averaged (digital
data).
"Y" in this column follows an y-array
"(text)" meaning of the y-values (optional)
The text in brackets will be shown on the display or plot as an explanation (legend) of
the data symbol.
The next letter specifies the line mode (optional):
( SEE "HELP LINEMODE" )
The following number specifies the data symbols (optional):
"0" no data symbol,
"1" to "10" different open data symbols,
"11" to "20" different filled datat symbols,
"21" to "25", "31" to 35", "41 to 45" are
hatched symbols
(the line distance of the hatching for the symbols 31 to 45 can be modified by the
parameter HATCHING),
"26" is one short horizontal line only,
"51" to "55", "58", and "59" are surrounded by a black line.
If no number is given, different data symbols are defined automatically for different data
columns. 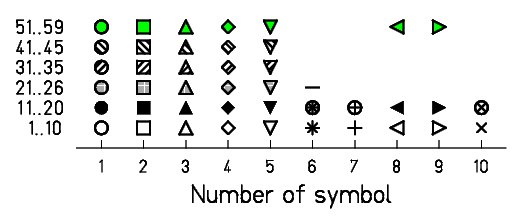
"S" is optional. It specifies a factor to modify the size of the symbol which is
defined in the preceding "Y"-column.
1 means the size as defined by the parameter SYMBOL.
Algebraic operations are allowed.
==> H: X Y,L11 S*0.35
1 3 0.5
3 7.3 1.37
IF the parameter ZAREA is specified, the area of the symbol is scaled. With the parameter
ZLOG the LOG10-value of the size or the area, respectively, is scaled. Additionally, the
parameters ZMIN and ZMAX may by used to scale the size of the symbols.
"SX" acts like "S", however the size unit
is related to one unit on the x axis. The size of the symbols will be one unit
of the x axis time the /SIZE(r) parameter of the GDISP or GPLOT command. This
option is only meaningful for linear x axis.
"SY" acts like "S", however the size unit is related to one
unit on the y axis. The size of the symbols will be one unit of the y axis time
the /SIZE(r) parameter of the GDISP or GPLOT command. This option is only
meaningful for linear x axis.
"A" like "Y", but the data of this array are added to the
"A", "M" or "Y" data column to the left. (use
"A*-1" for subtracting the data)
==> H: X Y,N0 A,L11
"M" like "Y", but the data of this array are multiplied with the
"A", "M" or "Y" data column to the left. (use
"M**-1" for dividing the data)
==> H: X Y,P1 M**-1,D14
"B" like "Y", but additionally this array is taken as a polygon
boundary for the 2-dim plot (contour or isom.)
"D" in this column follows the error value of the x or y value to the left.
The error in x-direction is only shown together with an error in y-direction.
"+" positive error (optional) (example: D+).
"-" negative error (optional) (example: D-).
if "+" and "-" are not or both given, the error is drawn in both
directions.
"%" relative error, given in percent (optional) (example: D%).
",T" means 'thick'' error bars (example: D,T).
Error bars are normally drawn with perpendicular lines at the lower and upper ends of the bars.
With ",I" , these lines are omitted (example : D,TI).
"N" the data in this column are ignored
The letters X, Y and N may appear in any order. Thus you may easily select part of the
data to be shown or you may change the x- and the y-axis.
A common modification of one column of a data-block may be defined by an addition to the
corresponding header specification. (see HELP ARITHMETICS)
==> H: X Y1+X-5,L1
1 10
2 20
,
An arithmetic expression of the data in a column may be added:
,==> H: X Y1 (Y = 1.37 * X - COS(Y1))
1 0.1
2 0.2
...
(The order of X, Y1 and Y is free.)
The result is a plot of two values (Y1 and Y) per x value.
Using this feature, it is also possible to define statistical error bars very simply:
==> H: X Y1 (D = sqrt(Y1))
3 325
5 488
7 531
For drawing a function without explicitly listing the data points, you may
implicitly
define both x and y values:
==> H: (X = 1 TO 10 BY 0.01) (Y = COS(X))
Legends and line modes are supported also for implicitely defined y
values:
==> H: (X = 1 TO 10 BY 0.01) (Y = COS(X))(Wave),STR0
Restriction:
Only one implicitly defined y array is allowed per header line!
Several header lines may appear in the dataset, followed by different data.
The number following X indicates an additional dimension which can be stretched in the
direction of the y-axis by the parameter "SHIFT" relative to the first curve in
the plot. If this number is omitted, a distance of (1 * SHIFT) is assumed (i.e. X0 .. X1
.. X2 .. X3 ..).
4.2. Representation of 2-dim data in a contour or a cluster plot:
(SEE "HELP 2DIM")
4.3 Specifying the representation of analyzers:
(SEE "HELP ANAL")
5. any line after the header line: data, comment, text or preset parameters
5.1 Data as defined by the header line in any format
==> 124 6.60 11.11
126 6.57 11.94
(a ";" can be put instead of beginning a new line)
==> 124,6.60,11.11; 126,6.57,11.94;
if a ";" would appear after each number, it may be omitted.
5.2 Comment to be ignored by the program
==> C: Data of ref. (DaS78)
5.3 Text to be written on the plot
(SEE "HELP TEXT")
5.4 Preset parameters for the plot or display
==> P: XLIN SCA(1.2) FORMAT(0.8)
All parameters of the commands GDISP or GPLOT, and some parameters of GREAD
and GSET may be specified in the dataset. The actual
representation is
added to the dataset with the command GSAVE.
Some parameters which are needed relatively seldom can only be specified in the dataset:
==> P: AXCOL(B) -- draw
the axes with blue colour
==> P: AXIS(LEFT,DOWN, ...) -- draw only "left",
"right", "upper"
or "down" axis without numbers and text
==> P: AXIS(LEFT,NUMBERS,TEXT) -- draw left axis with
numbers and text
==> P: AXIS(R,N,T;U,N,T) -- draw right and upper axes with
numbers and text
==> P: ACCUMULATE -- accumulate data (add data point to
the sum of all preceding data)
5.5 Legend which describes the data symbols
==> L: ZSCALE(0.1, 0.1 mb) -- draw description of
cluster (legend for Z scale) of 2-dim. data
==> L: XREL(R) YREL(R) -- position the legend in
units relative to the axes
How to define the legend for 1-dimensional data, see above.
5.6 Interactive parameters
==> IP: RCAL1 = 0.536 -- assign a value to an
interactive parameter (like the command IPAR).
III. Special Syntax Rules:
Lines ending with the characters ' +' are concatenated with the following line.
|